Addressing the GTI Report on HSD Process with Conclusive Evidence

Addressing the GTI Report on HSD Process with Conclusive Evidence, Oct. 2022
Get the download: “Addressing the GTI Report on HSD Process with Conclusive Evidence”
GTI’s report titled “Validating Non-Destructive tools for Surface to Bulk Correlations of Yield Strength, Toughness, and Chemistry,” released in September 2021, was highly inaccurate and inconsistent with prior research, including a 2018 report by PRCI. In this report, MMT demonstrates the multiple errors committed by GTI that led to false results.
Simon Bellemare, Ryan Lacy, Intisar Rizwan i Haque, Brendon Willey
Key GTI Errors At a Glance
- Comparing a Frontics final commercial output with an MMT intermediate output
- Not complying with APL 5L in regards to pipe cutouts orientation – MMT is outperforming Frontics by 1.9 ksi
- The machine learning data must be properly split between training and test sets.
If the training set is too large proportional to the entire dataset, models are likely to be overfit and perform poorly on samples outside of the training set - Using only one out of three key MMT HSD field outputs, which explains why GTI was unable to calibrate a model to perform as well as the HSD performs on blind tests
Incorrect Comparison
The first part of the GTI report compares the final Frontics bulk strength, a commercial output using destructive test data, against an MMT intermediate process variable of surface strength, later calibrated using API 5L destructive data.
This comparison overlooks a significant part of the MMT testing process, resulting in comparison metrics that are not representative of the tool’s actual performance and do not provide a fair comparison of the two technologies.
Incorrect Benchmark
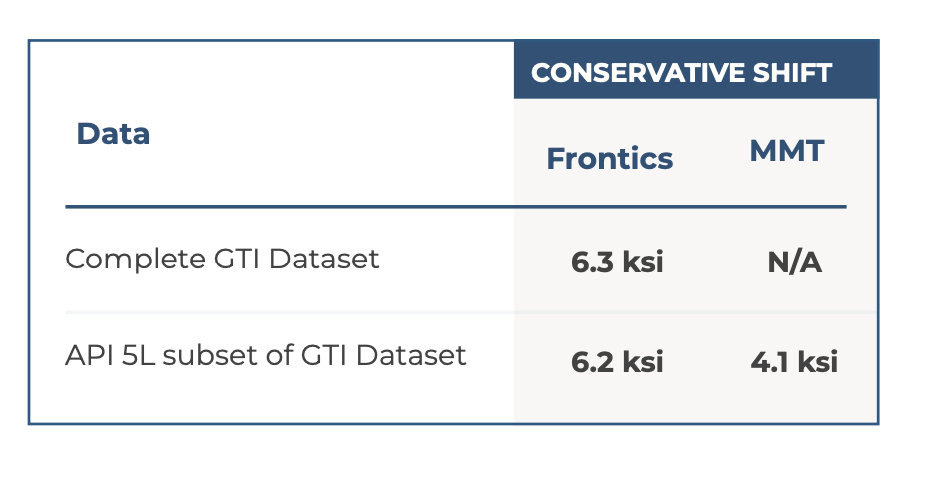
GTI did not follow API 5L manufacturing specifications regarding the pipe cutouts’ orientation for evaluating laboratory tensile strength. While API 5L mandates transverse cutouts for pipe diameters over 8.625 inches, GTI used only longitudinal cutouts for 27 of the 70 samples in its study. This approach is not industry-standard, as transverse cutouts allow for testing the pipe in the direction of the highest stress. Eliminating results from the incorrect laboratory testing orientation shows that MMT outperformed Frontics with a calculated tool tolerance of 6.0 ksi versus 4.1 ksi.
Overfit Models
GTI misapplied machine learning by using too many model parameters and an incorrect split of training and learning datasets and failed to conduct blind testing. This approach resulted in overfitting models that exceed the optimal model complexity, likely perform poorly on samples outside of the training dataset, and mislead potential users on Frontics accuracy. GTI also used only one out of three key HSD field outputs for models using HSD data, leading to an inability to calibrate a model that performs as well as HSD on blind tests.
Accuracy is Paramount
MMT helps identify low-strength outliers and lower risk to operators
- U.S. assets average – 56 ksi (sample HSD data) and conservative shift of 7.7 ksi
- Frontics conservative shift: 5-6 ksi
- MMT conservative shift: 3-4 ksi
1. INTRODUCTION
Requirements When Determining Material Strength With Non-destructive Tools
PHMSA’s Mega Rule for gas transmission, published in September 2019, requires “traceable, verifiable, and complete” (TVC) records, including pipeline material strength or grade. When records are not TVC, section 49 CFR 192.607(c) provides requirements to determine material strength either destructively or nondestructively. If determining material strength with non-destructive tools, one must:
- Use methods, tools, procedures, and techniques a subject matter expert has validated by comparison with destructive results.
- Conservatively account for measurement inaccuracy and uncertainty using reliable engineering and analyses.
- Use properly-calibrated test equipment.
Unity Plots Visualize Accuracy
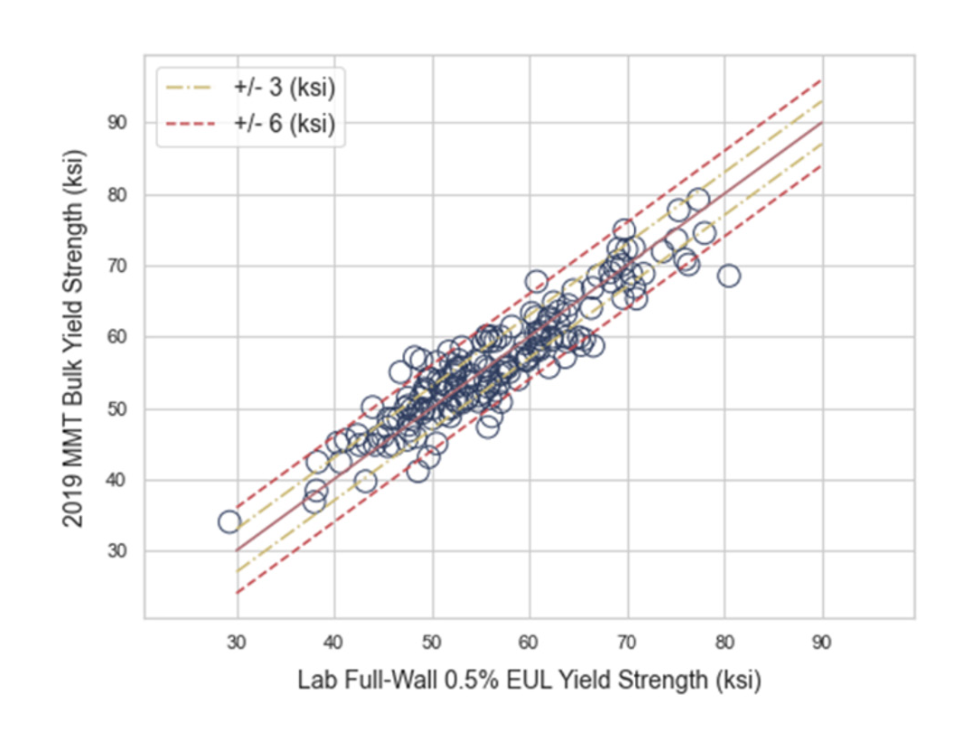
Unity plots compare lab-measured properties with NDE measurements, providing a visualization of NDE accuracy. Accurate tools will show values that are near the unity line. In contrast, inaccurate tools show data as a large scatter around the unity line. Figure 1 shows the unity plot for MMT’s 2019 HSD process. The HSD technology provides a conservative shift of 3.0 ksi at 80% certainty. MMT is unique in providing a tool tolerance with a level of confidence backed by a transparent database.
Blind Testing Determines Measurement Accuracy With Properties Unknown
Blind testing is a critical factor in validation, as it determines measurement accuracy on samples with properties unknown to the testing party. Operators validate NDE performance on their assets by reporting NDE process results without prior knowledge of the lab measurements. As a result, NDE performance is confirmed on
similar assets with similar test conditions. A lack of blind testing creates a potential gap between the expected performance and the actual performance of an NDE technology.
Conservative Shift Required
To account for variability between lab measurements and NDE measurements, a conservative shift is required by 192.607. The implication from the regulations is that underestimation is acceptable, while an overestimation is not. As a result, the conservative shift is a 1-side prediction interval at 80% certainty.
Figure 1. Unity plot depicting MMT performance against MMT database. MMT data tightly following the unity line shows the proximity between the MMT predictions and the laboratory values.
2. BACKGROUND INFORMATION
2018
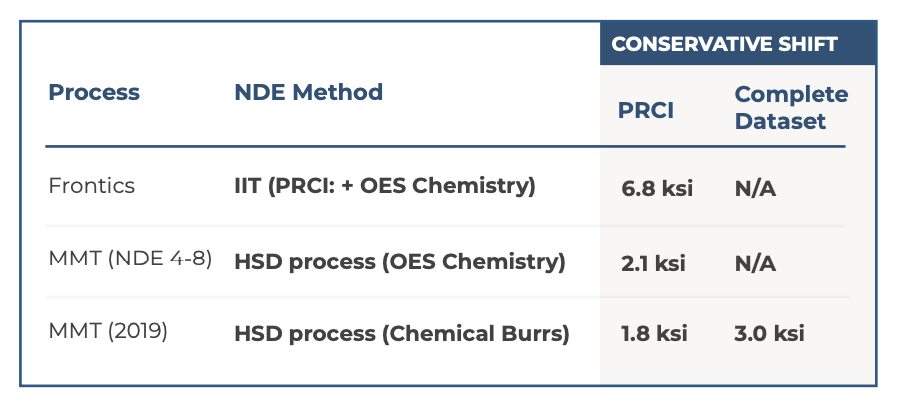
PRCI blind-tested alternative nondestructive material verifications and published report NDE 4-8 [2]. PRCI found that the HSD, compared to Frontics and other NDE techniques, is “the best performing technique.” Table 1 depicts the conservative shift for multiple processes below.
Table 1. Conservative shift for the different NDE methods if a 1-sided prediction interval statistical criteria are used with an 80% level of certainty using available data to calculate. Updated MMT models and larger datasets offer a conservative shift of 3.0 ksi commercially.
Operators have relied on the PRCI NDE 4-8 report to prove that the HSD methodology is validated and the most accurate commercially available NDE tool for pipe grade.
2019
MMT performed sample testing as a part of the GTI NDE validation project.
2021
In September of 2021, GTI published their report titled “Validating Non-Destructive tools for Surface to Bulk Correlations of Yield Strength, Toughness, and Chemistry,” which included an analysis of the MMT data gathered in 2019. The report consists of terminology such as “MMT Performance” without expressed limitations on the work’s applicability for commercial use. For months, MMT and some GTI project sponsors appealed to GTI for wording changes without success. It is the opinion of MMT’s engineering team that all the conclusions by
GTI concerning technology validation and comparative performance are invalidated by facts and information that should have been considered. The GTI report seemingly contradicts the PRCI NDE 4-8 findings, creating ambiguity and a need for operators to understand why there is a discrepancy between the GTI and PRCI reports and to make their technology validation requirements accordingly.
2022
MMT presents a rebuttal to GTI report via webinar.
3. ERRORS BY GTI
Throughout the GTI report, the work done and the analysis presented multiple errors that resulted in misleading figures and conclusions regarding the HSD technology and material strength determination. We’ll describe a selection of these errors in further detail below.
3.1 GTI Incorrectly Compared Datasets
PRCI blind-tested alternative nondestructive material verifications and published report NDE 4-8 [2]. PRCI found that the HSD, compared to Frontics and other NDE techniques, is “the best performing technique.” Table 1 depicts the conservative shift for multiple processes below.
Surface vs. Bulk
NDE material verification processes perform a direct measurement near the surface on the outside diameter of the pipe to infer the bulk properties for the entire pipe wall. For welded samples, surface strength is generally higher than the bulk values determined through destructive lab testing. This difference results from manufacturing where the material is often cold-rolled and bent for a pipe.
The GTI report uses “base” or “bulk” when referencing the destructive values or the nondestructive measurements that correspond to destructive values [3].
How Each Process Works
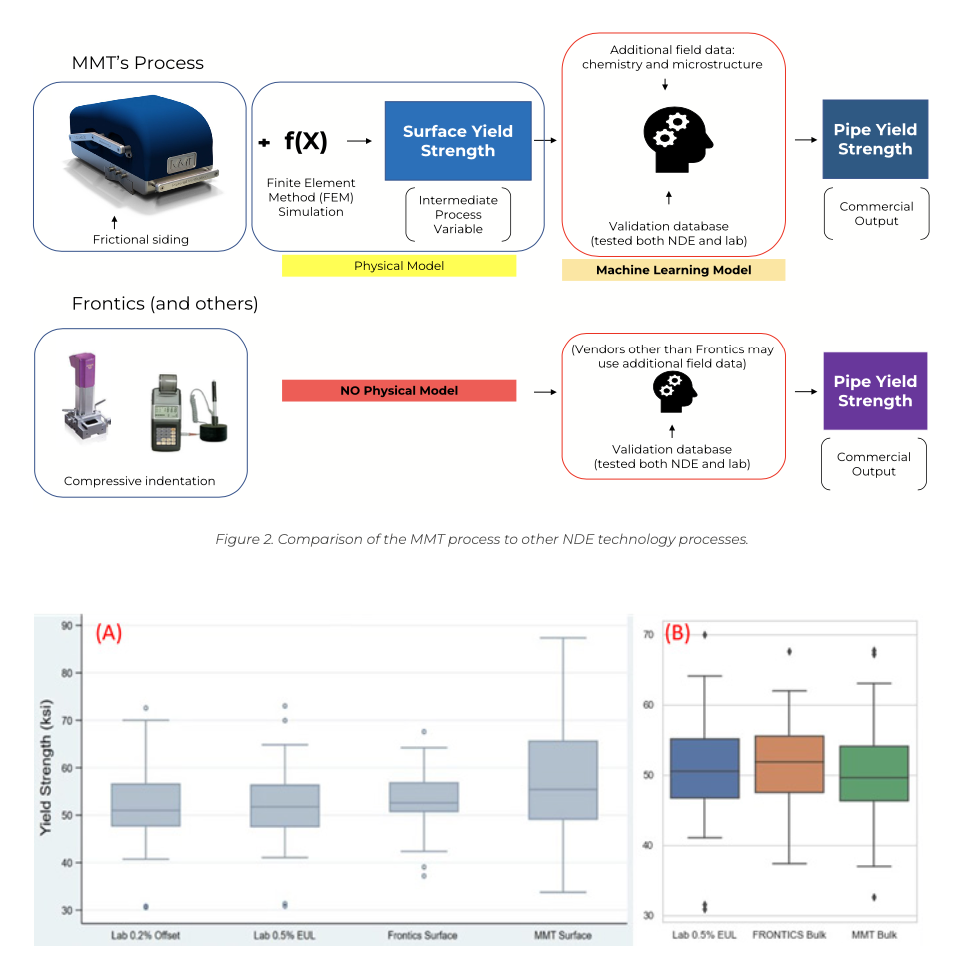
While both technologies provide estimates of bulk strength values offered commercially, the methods used by MMT and Frontics are markedly different, as shown in Figure 2.
MMT uses a contact mechanics technique known as frictional sliding to gather raw surface data, which is input into a Finite Element Analysis (FEA) simulation to generate a surface strength value. The surface strength value is an intermediate process variable. Additional field data, including chemistry and microstructure data, is used in MMT’s machine learning model to deliver the final strength estimate provided as the commercial offering.
Frontics uses compressive indentation testing results, which are used directly in their machine learning for
final strength estimates provided as the commercial offering. There is no physical modeling using FEA within
the Frontics process. Without this step, there is no surface yield strength. The raw data is provided to machine learning models for final strength determination. Specific vendors may opt to use additional field data and adjust the final value. Still, the use of other field data will vary from vendor to vendor.
What GTI Did
GTI requested MMT to provide the intermediate process surface strength variable, which is not provided as part of the commercial MMT process. The intermediate surface strength from the MMT process was used as a part of the GTI analysis and compared to the Frontics final bulk values in GTI report Figure 12, where GTI incorrectly labeled Frontics results as surface values. As verification that GTI should not have labeled Frontics results as surface strength, Table 7 of the GTI report depicts the master database and show no variable corresponding to a Frontics value for surface strength [3].
Misleading Results
Due to the GTI report and the incorrect comparison of datasets, operators can be misled into a faulty understanding of tool performance. One example of this misleading representation is shown in Figure 3, which is produced and corrected.
Figure 3.
(A): GTI report figure 11 depicts an example of misinterpreted data, comparing “Frontics Surface,” which is mislabeled and should read “Frontics Bulk,” and the MMT Surface data to lab values.
(B): Shows a corrected version of GTI Figure 11, correctly comparing NDE bulk measurements to laboratory values.
3.2 Baseline Data Used To Evaluate NDE Performance Was Not Collected per API 5L
API Test Orientation
The new regulation in 49 CFR 192.607(c)(2) explicitly identifies the API 5L benchmark as the tensile testing specification for pipeline material strength. Per Figure 4, API 5L requires that a pipeline with OD larger than 8 5/8 inches be tested in the transverse direction. This results from the transverse tensile best representing the hoop stress and the primary loading orientation for in-service pipelines.
Figure 4. Representation of testing orientation for various sample diameter sizes. API 5L specifies samples with diameters below 8.625” should be tested longitudinally, while samples greater than 8.625” should be tested transversely.
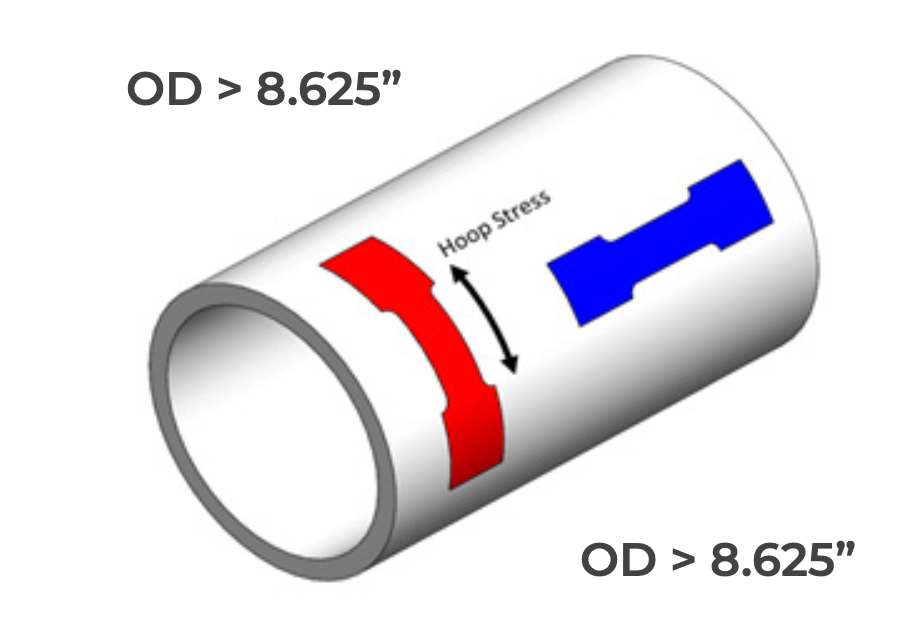
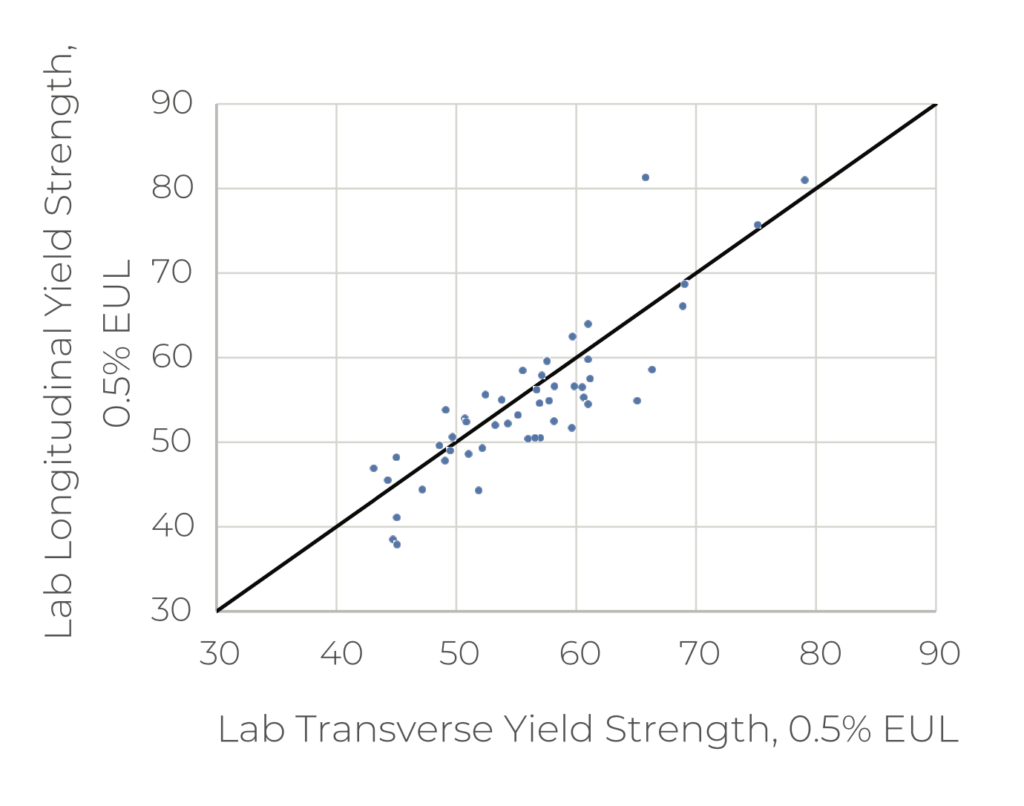
GTI did not follow API 5L and instead tested in accordance with ASTM A370 where all tensile coupons are cut and tested in the longitudinal direction. 27 of the 70 total samples for the GTI report were lab tested in the incorrect orientation. To demonstrate the importance of cutout orientation, Figure 5 depicts a comparison of results from transverse and longitudinal sampling from the PRCI NDE 4-8 program [2]. The trend of data points below the unity line shows that the yield of transverse tensile samples tends to test higher than in the longitudinal direction. MMT strength predictions use API 5L tensile testing as the benchmark, aligning with the explicit Mega Rule requirement in 49 CFR 192.607(c)(2).
Figure 5. Comparison of transverse and longitudinal tensile tests from the PRCI NDE4-8 program [2]. While there is variability, there is a general trend of transverse samples measuring slightly higher than transverse samples. API 5L requires transverse testing on samples greater than 8.625” in diameter.
The title, timing, and project objective section of the GTI report position it as a resource that operators were
to consider towards implementing 49 CFR 192.607 compliance; however, the baseline comparison testing
was not completed according to API 5L, which is specified in the regulation [3]. Operators may be misled and opt for a technology that does not achieve the desired results based on a report that does not comply with regulations. After removing the 27 samples API 5L from the comparative dataset did not test, Table 2 compares the conservative shifts for Frontics and MMT using the GTI dataset. The Frontics conservative shift is roughly 50% worse than MMT.
Table 2. Conservative shift for both Frontics and MMT was evaluated using the complete GTI dataset. Those samples were tested per API 5L specifications.
3.3 GTI builds overly complex predictive models resulting in unrealistic accuracy
Building AI Models
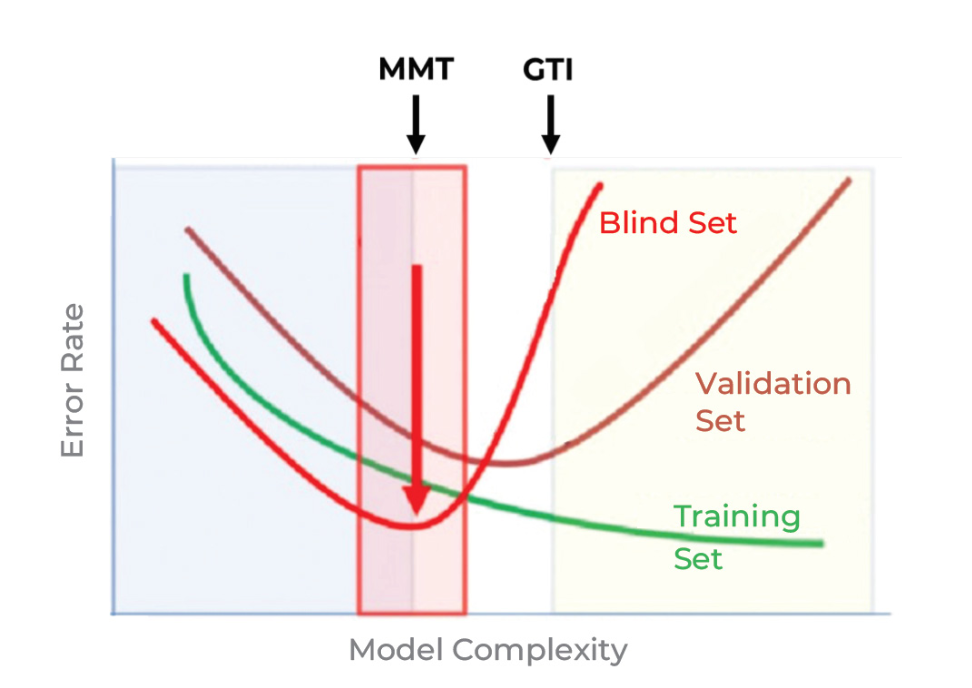
Good quality AI modeling requires a balance between the model input parameters, the training sets, the validation sets, and the true blind testing sets. Optimal input parameters will vary from model to model. Still, too many parameters, or quadratic terms, will often lead to overfitting, where the model performs well on training and validation data but poorly on other data sets. Figure 6 shows the importance of evaluating the model performance against a blind data set. As the error rate reduces and performance increases on the training and validation sets, model performance on the blind set may worsen.
Figure 6. The minimum error in the blind set (best model performance) is a lesser model complexity than would be inferred from the validation set.
GTI Modeling Process
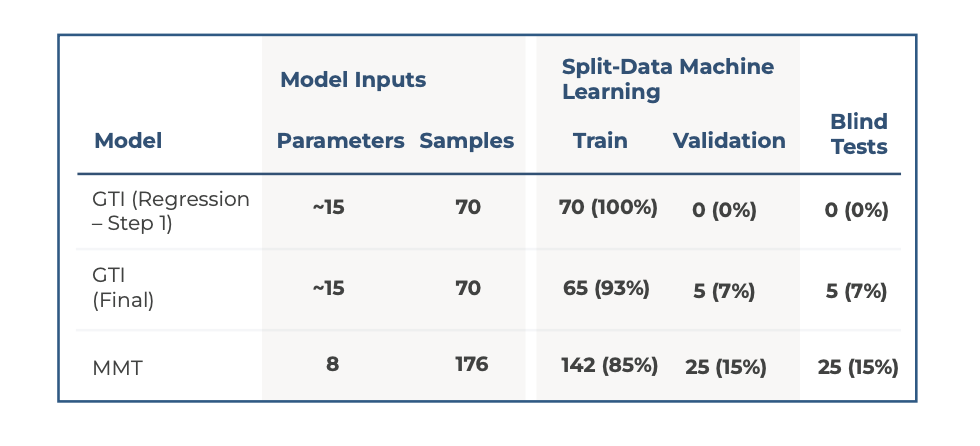
GTI’s modeling process is overly complex, using too many parameters, having a poor balance between training and learning data sets, and was not evaluated through blind testing.
- First, GTI uses a quadratic model, which is more prone to overfitting than a linear model.
- Second, GTI uses an overly large number of input parameters for their model, using nearly twice as many input parameters to model a sample set that is less than half the MMT database.
- Third, the machine learning data must be properly split between training and learning sets, with an overly populated training dataset models are likely to be overfit and perform poorly on samples outside of the training set.
- Lastly, GTI did not blind-test the developed models, instead evaluating the models based on the same data used to create the models. Without blind testing, it is impossible to assess model performance appropriately.The following table compares the model inputs, machine learning sets, and blind testing of the GTI models to the balanced and blind-tested MMT model.Table 3. Without an appropriate balance of training, validation, and blind data, AI models are not adequately evaluated and perform poorly in real-world scenarios.
GTI’s Model Implications
GTI’s model is overly complex and boasts performance that would not be reflected in real-world blind testing. By failing to disclose the above shortcomings, GTI’s report may lead operators to incorrectly evaluate assets using an unproven model that has not been evaluated outside of the GTI dataset also used for training and split-data validation.
Remark on GTI’s Flawed Approach
GTI used machine learning and showed a better model using the Frontics bulk result than the HSD surface
yield strength model. Of the eight parameters in MMT models, 3 are surface measurements from the HSD.
GTI presented a flawed approach. The GTI model only used one of the three independent HSD surface measurements. The usefulness of one-third of the input from the HSD should not be compared with the Frontics bulk result.
4. MMT REFUTES GTI’S REPORT
4.1 Incomplete Technology Validation
49 CFR 192.607 (d)(1) specifies that any procedures using nondestructive methods must “use methods, tools, procedures, and techniques that have been validated.” Any attempt to validate a process must also validate all four listed areas. For this purpose:
- Methods: Methods commonly used for yield strength verification include ball Indentation and frictional sliding.
- Tools: Frontics and MMT offer commercial tools for material verification, with Frontics using the ball indentation method and MMT using the frictional sliding method.
- Procedures: Procedures for the Frontics tools can be found in the equipment product manual. However, different inspection service vendors have their own additional procedures. MMT’s device has a well-defined set of procedures outlined in MMT-F001, which all inspection service vendors use.
- Techniques: Techniques may refer to how individual technicians execute the procedures. User training, certification, and ongoing performance evaluations ensure consistent results. Only MMT provides a platform for such consistency.What GTI DidThe GTI report focused on tool validation, as specified in the report’s title. In particular, this report evaluated Frontics bulk measurements and HSD surface measurements against tensile samples tested per ASTM A370 (Sections 4.1 and 4.2 detail concerns with the basis for GTI tool validation). Conceptually, evaluating tool output against the gold standard would effectively assess performance. The effectiveness of the tool validation is questionable based on the foundation of the GTI analysis, and as such, improvements are necessary.What GTI MissedThe GTI report concentrated on tool validation and did not evaluate the methods, procedures, or techniques honestly. As a result, GTI did not perform a complete process validation, which would require evaluations of the three remaining criteria outlined by the regulation.
4.2 Understanding Field Vibration
All in-service assets will experience vibration and cannot be fully isolated from its effects. Vibration can be caused by multiple sources, including flow, mechanical forces, such as pumps and compressors, acoustic excitations, momentum changes, and forces external to the pipeline system. For in-service pipelines, vibration iIs primarily radial, with little effect longitudinally.
Impact of Field Vibration
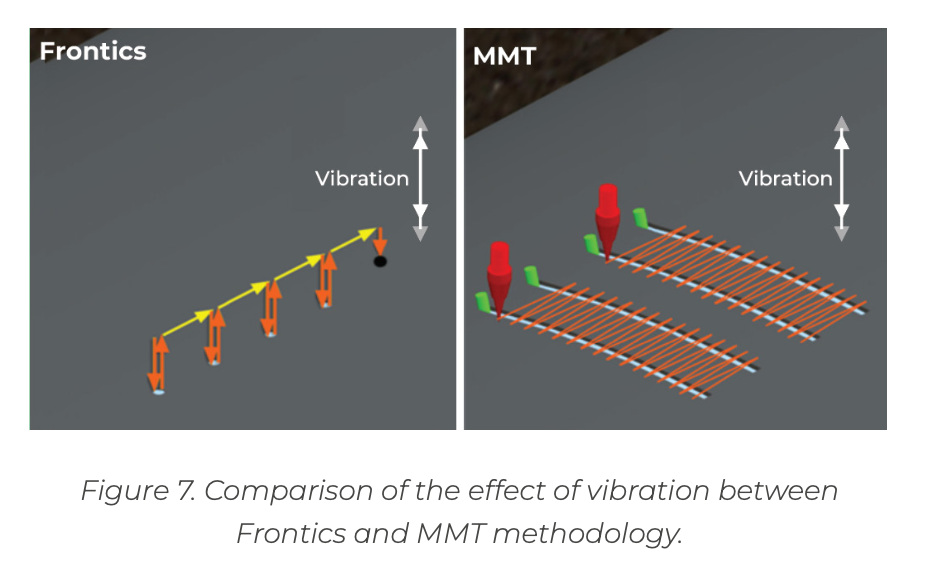
Small vibrations do not cause an issue for pipeline operation but can be problematic for material testing. Most NDE technologies make measurements through surface indentations normal to the pipe body. As a result, even slight vibration will influence the measured response, as the vibration and measurement are in the same direction.
HSD Effect of Field Vibration
HSD measurements are conducted longitudinally, not radially, and as a result, are not impacted by vibration
in the same manner as other technologies. The HSD creates a small set of grooves using a known stylus geometries, known loads, and traveling circumferentially across the surface. HSD technology uses a longitudinal measurement of the groove width to determine the estimated strength.
Figure 7. Comparison of the effect of vibration between Frontics and MMT methodology.
4.3 Incorrect GTI Conclusions Discussion of 95% Confidence
The GTI methodology for determining a confidence interval for comparison of MMTs estimates vs. actual lab strengths is flawed due to reasons of non-compliance with API–5L lab testing standard and use of 0.2% offset instead of 0.5% EUL for Full-Wall Lab values. Therefore, using the MMT model predictions, GTI’s determination of 95% confidence interval overlap with the unity line ranging from 41 to 53 (ksi), is invalid and inconsequential.
Non-Conservative Bias
The GTI wrongly stated that the inherent baseline surface NDE data is biased towards non-conservative predictions for steels at approximately 50 ksi or higher. The prediction interval determined using the API–5L compliant samples for MMTs strength estimates has less non-conservative bias than Frontics.
Recommending Further Research
The GTI recommendation of further research into the HSD process due to non-conservative bias is not based
on MMT’s commercial offering and is thus rebutted. This statement is based on the GTI analysis of HSD surface strength, an intermediate process variable. Meanwhile, MMT has a continuous quality improvement (CQI) process to ensure our strength estimates’ reliability and validity. This is achieved through a periodic renewal of field
staff certifications, expert oversight of all field data collection, improvements to machine learning models, and increases in the size of the validation database through additional destructive lab testing.
5. THE IMPORTANCE OF ACCURACY
It’s important to reiterate that the congressional mandate and the intent behind the new regulation, including 49 CFR 192.607, is to identify and remediate true outliers in the distribution of pipeline assets. Two objectives can be derived from this purpose. The few outliers which have low strength shall be detected. In parallel, the large population of high-performing assets shall be managed using re-confirmed or newly determined material properties.
Figure 8. Normal distribution of the US pipeline population. Based on a data set of nearly 1000 pipelines, the average strength was 56 ksi. As a result, the 80% conservative shift falls at 48 ksi.
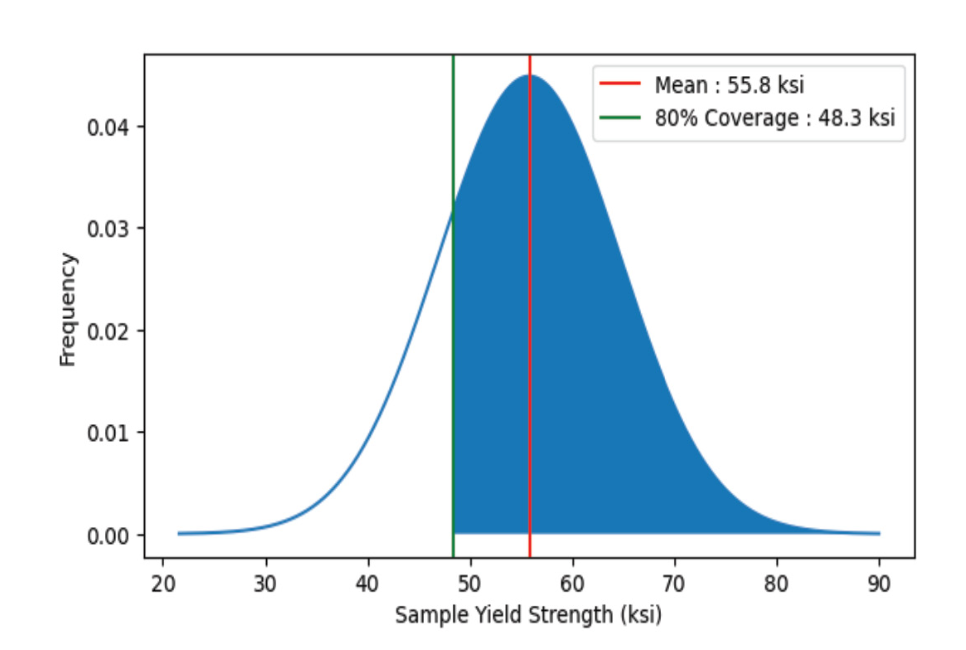
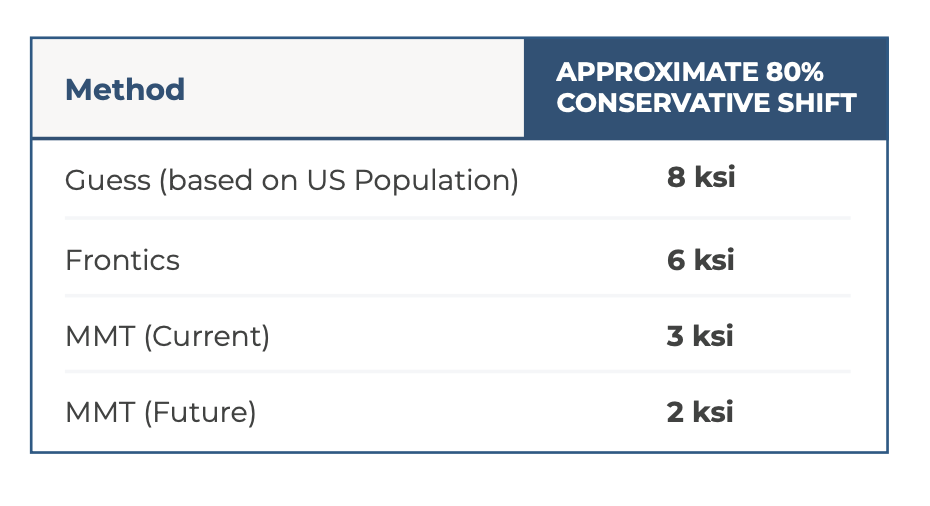
Without field data, one could stipulate a strength of 56 ksi for any given asset because that is the average strength for the U.S. pipeline system. In doing so, a conservative shift of 8 ksi covers a 1-sided prediction interval at 80% certainty without any field testing. Assuming a conservative strength, 48 ksi would not meet either of the two regulation goals:
- Accurately identifying low-strength outliers
- Positively confirming high-strength assets
Field processes that overestimate the yield strength of low-strength assets and underestimate the yield strength of high-strength assets expose the asset owners to a risk of missing the objectives and undermining the purpose. Without strong physical fundamentals and implementation rigor, prediction processes can be established with an insight into the overall distribution of strength properties of all vintage pipeline assets in the United States, such as expected yield strength of 56 +/- 8 ksi at 80% certainty, Figure 8. Detecting such a deceiving process requires a comprehensive blind testing validation program.
Table 4. Comparison of various yield strength determination methods based on the conservative shift that would be applied. The current MMT method results in a 3 ksi shift, and we expect future model improvement to result in a 2 ksi conservative shift.
6. CONCLUSIONS
From the basis mentioned above, MMT has formed the following engineering opinions:
- GTI misused data in comparing MMT with Frontics using different outputs, portraying MMTs model performance as subpar and raising unwarranted questions about the MMT technology.
- Laboratory tensile test orientation not conforming to API 5L led to many incorrect GTI conclusions, including that the MMT process had non-conservative bias with certain line pipes.
- GTI developed models using Frontics data that were not blind tested, and they would perform poorly in blind testing.
This engineering report leads to the following MMT conclusions:
- Technology validation for in-situ material verification shall result in a unity plot and a level of measurement certainty applicable to the conditions in which the methods, tools, procedures, and techniques are being used in the field.
- The effect of field variables, such as typical pipe vibration, is an essential factor to consider in validating technologies.
- Because GTI did not perform such a validation process, all statements related to MMT performance and technology are unsupported and irrelevant in the application context to comply with the regulations.
- There are significant engineering risks associated with using material verification processes that are not supported by strong mechanical fundamentals, large blind testing dataset, and a level of accuracy sufficient to achieve the goal of detecting the very few outliers in pipeline systems and, importantly, positively verify the pipe grade for most assets.
7. REFERENCES
[1] PHMSA, “Pipeline Safety: Safety of Gas Transmission Pipelines: MAOP Reconfirmation, Expansion of Assessment Requirements, and Other Related Amendments”.
Federal Register, Vol. 84, No. 190, 2019.
[2] B. Amend, S. Riccardella, A. Dinovitzer, “Material verification – validation of in situ methods for material property determination,”
PRCI NDE-4-8, 2018.
[3] D. Ersoy, B. Miller, et al. “Validating Non-Destructive Tools for Surface to Bulk Correlations of Yield Strength, Toughness, and Chemistry,”
PHMSA 729, 2021.
